Math Topics
Learning Support
Professional
![]()
 This section contains news related to:
The Top Stories in Education, plus media literacy resources
Math Education and Standards in the News--Hot topics, including the Common Core State Standards Initiative and the National Assessment of Educational Progress Nation's Report Card.
Technology News dates of interest, including information about the U.S. Department of Education's National Education Technology Plan
![]()
|
BAM Radio Network-- National Public Radio on education K-12 Dive: K-12 "newsletters and website cover topics such as leadership, school models, technology, curriculum, professional development and more"
|
|
 Fake
news, including fake images, deep fake videos, phishing, fraud, fake
info on social media, and so on are among concerns when using media of
any kind. So, we need to learn how to critically analyze media,
including to recognize bias, question
sources, diversify our new sources and compare, and most of all to think
before we share information.
Fake
news, including fake images, deep fake videos, phishing, fraud, fake
info on social media, and so on are among concerns when using media of
any kind. So, we need to learn how to critically analyze media,
including to recognize bias, question
sources, diversify our new sources and compare, and most of all to think
before we share information.
Britannica Education produced Media Literacy for the Digital Era. This free guide includes "current insights, practical strategies, and interactive activities."
Common Sense Education has a section devoted to News and Media Literacy with lessons, videos, and classroom activities.
Critical Media Literacy Guides are included in a free e-book, Critical Media Literacy and Civic Learning, by Robert Maloy, Torrey Trust, Allison Butler, and Chenyang Xu (2021) of the University of Massachusetts. Nine guides contain key questions for teachers and students to help analyze social media, websites, news and newspapers; movies, television, images, advertisements; cartoons, comics, and memes; and artifical intelligence tools (e.g., ChatGPT).
In Teaching Fact vs. Fiction When Seeing Is No Longer Believing posted at ISTE, authors Jennifer LaGarda and Darren Hudgins (2022, January 20) recommended teaching students the 6 R's:
They also recommended teaching important skills, such as:
The Center for News Literacy at Stoney Brook University has multiple resources, which "can help students of all ages recognize the differences between fact and rumor, news and advertising, news and opinion, and bias and fairness." The site also includes a curriculum toolbox with free resources for educators and citizens.
Ten Questions for Fake News Detection, developed by the News Literacy Project, will help you sort out fact from fiction. Red flags include such things as your emotional reaction to the news, where you found it, use of excessive punctuation and CAPS, claims made, the nature of the source, who authored the article and its date (or lack thereof), lack of citations, and if content can be verified from other news sources. The News Literacy Project also has a series of tools for educators to use in their classrooms to help students develop news literacy. For example, Checkology is a free e-learning platform for middle and high school learners, although younger or older learners can benefit. It features "engaging, authoritative lessons on subjects like news media bias, misinformation, conspiratorial thinking and more. Learners develop the ability to identify credible information, seek out reliable sources and apply critical thinking skills to separate fact-based content from falsehoods" (About section).
In her School Library Journal blog post, Truth, truthiness, triangulation: A news literacy toolkit for a "post-truth" world, Joyce Valencia (2016, November 26) provides numerous resources to help all to become news literate.
National Association for Media Literacy Education includes numerous resources on this topic. It also produces the Journal of Media Literacy Education, an open-access peer-reviewed journal.
NewseumED provides free resources (e.g., videos, lessons and activities, guest blogs, and case studies) for developing media literacy. Audience is primarily middle and high school and up.
KQED Teach offers a free self-paced course for K-12 educators: Analyzing Media Messages: Bias, Motivation and Production Choices. To help teach learners how to critically evaluate media, in this course you will "Learn how media messages are built not just through scripts but production choices like framing and music and how these choices influence our interpretation and actions."
Additional resources include:
FactCheck.org from the Annenberg Public Policy Center
Google Fact Check Explorer search engine.
Verify lets you explore the latest in fake and real news. Each article includes an explanatory video and sources of information provided.
 Consider
the data presented in daily news such as weather reports, sports
statistics, stock market numbers, top rated TV shows (how were those
numbers generated), and so on. Investigate claims in consumer
advertisements for products, accuracy of graphs presented in newspaper
ads and magazines (are they misleading) and so on.
Consider
the data presented in daily news such as weather reports, sports
statistics, stock market numbers, top rated TV shows (how were those
numbers generated), and so on. Investigate claims in consumer
advertisements for products, accuracy of graphs presented in newspaper
ads and magazines (are they misleading) and so on.
Project Look Sharp at Ithaca College has several lessons that can be used in K-16 math classes. Search by keyword, subject, and grade band. Over 900 lessons and activities are available in multiple subjects.
![]()

HOT! On January 27, 2016, The Atlantic published an article by A. K. Whitney titled The Man Who Tried to Kill Math in America, with subheading "One educator's reform efforts in the early 20th century say a lot about current attacks on the Common Core." That educator was William H. Kilpatrick who "believed that anything beyond arithmetic was useless to most of the population. He even worried that the instruction of complex math was harmful to everyday living" (Whitney, 2016, para. 7).
Owing to his influence in education, Kilpatrick was asked to head a National Education Association committee investigating math instruction reform, which resulted in a 1920 report, "The Problem of Mathematics in Secondary Education." Its content "became part of a larger treatise on public education that provided a roadmap for America’s schools for decades to come" (para. 12). So, if you are seeking to understand some of the opposition to the Common Core standards movement, this article is one to read.
HOT! Scoop.it!: Common Core Online: Mathematics: "this scoop.it is intended to curate all materials relevant to implementation of the standards and preparation for next generation assessments." Curated by Darren Burris. You'll want to bookmark this site.
HOT! Math in the Media from the American Mathematical Society provides news stories on math in current events and ideas for classroom activities for students to practice concepts discussed in the news.
NCTM News provides the latest top stories on math education, including connecting math education research to the classroom.
Plan ahead: April is Mathematics and Statistics Awareness Month. This annual event is sponsored by the American Mathematical Society, the American Statistical Association, the Mathematical Association of America, and the Society for Industrial and Applied Mathematics. Look for resources, activities of others, and post your activity.
HOT: September 12, 2006:
In response to the call for a more coherent curriculum, the National Council of Teachers of
Mathematics released
Curriculum Focal
Points for Prekindergarten through Grade 8 Mathematics: A Quest for
Coherence (NCTM, 2006a). In its press release on September 12,
2006, NCTM indicated that this document identifies three important
topics for mathematics at each grade level preK-8 and presents "a vision
for the design of the next generation of state curriculum standards and
state tests" (NCTM, 2006b, para. 3).
HOT: April 4, 2007:
The U.S. Department of Education released its report for Congress, Effectiveness of Reading and Mathematics
Software Products: Findings from the First Student Cohort. It
received immediate reaction from leaders around the country
concerned about the effectiveness of technology in education and
results of this study. A key finding noted by Mathematica
Policy Research, Inc. indicated, "Test scores were not
significantly higher in classrooms using the reading and mathematics
software products than those in control classrooms. In each of the
four groups of products-reading in first grade and in fourth grade,
mathematics in sixth grade, and high school algebra-the evaluation
found no significant differences in student achievement between the
classrooms that used the technology products and classrooms that did
not." Read this full report:
https://ies.ed.gov/ncee/pubs/20074005/
HOT: 2007:
Results are in for the
2007 National Assessment of Educational
Progress Nation's Report Card: Mathematics and Reading.
Mark Schneider, Commissioner, National Center for Education Statistics, provided the following results in a press release webcast of September 25, 2007. Tests were given in reading and mathematics from January-March 2007 to a sample of 390,000 students in grade 4 and 310,000 students in grade 8. Results are available for the nation, each of the 50 states, the District of Columbia, and the Department of Defense school system. NAEP reported results as average scale scores and the percentage of students at or above basic, proficient, and advanced achievement levels.
At grade 4 overall findings from 2005 to 2007:
At grade 8 overall findings from 2005 to 2007:
While it is not the role of NAEP to explain results, some who read the report might attribute gains to an effort to teach mathematics in a more rigorous way, an emphasis on use of precise language, and developments in continuous and coherent curricula. Perhaps one explanation for a rise in grade 8 math achievement could be the rise of the percentage of students who complete algebra 1 in grade 8 from when NAEP was first administered in 1990. Some might attribute gains to No Child Left Behind’s focus on reform, particularly at the elementary levels, or the more wide-spread use of data-driven decision-making for school improvement.
However, not every state made gains and much remains to be done to improve achievement of the many students performing at or below the basic and proficient levels. Results must also be considered in light of the large demographic changes in the country over the past 15 years. For example, there have been large increases in the Hispanic population in schools. There is an increase in the number of English language learners and students with identified special needs. For those states that did not do as well as expected, policy makers and the public need first to look at any demographic and economic shifts within their state before turning to education groups for possible explanation of results and examination of practices (e.g., inclusion rates).
Associate Commissioner Peggy G. Carr also commented about the results in her Q&A session StatChat. Excerpts include:
"NAEP's design is not capable of establishing a causal connection between teacher background and student performance."
"...the scores reflect the performance of the current demographic distribution...The inclusion rates do vary over time and vary across states. Because the representation of samples is ultimately a validity issue, NCES [National Center for Education Statistics] has investigated scenarios for estimating what the average scores might have been if excluded students had been assessed."
"IES is again planning to release two separate reports on American Indian/Alaska Native students [Spring 2008]. The first report will focus on student achievement in reading and mathematics. This year we will have results for 11 states with high American Indian/Alaska Native student populations. ...There are some mathematics and reading results for these 11 states (based on just their public school data) available now on the NAEP Data Explorer." [Note: Data Explorer is found at https://www.nationsreportcard.gov/data_tools.aspx]
If state testing results differ from NAEP, consider: "...there are many possible reasons why results from two tests may look different from each other. If you are looking at the percentage of students who have reached a level of proficiency on two different tests, it really depends on how proficiency is defined on the two tests and where the 'cut score' (or passing score) is set on each. You may be interested in a report we released on this topic earlier this year entitled "Mapping 2005 State Proficiency Standards Onto the NAEP Scales."
"...a higher score in one subject than another does not necessarily mean that performance is better in that subject. In NAEP, scores for different subjects are not comparable. The score scales are set independently for each subject. So, for example, a score of 215 in reading does not necessarily reflect the same performance level as 215 in mathematics."
"NAEP allows students with disabilities and English language learners to use most of the testing accommodations that they receive for state or district tests."
HOT:
March 13, 2008:
The National Mathematics Advisory Panel, created by
President George W. Bush in April 2006, released the results of its
study to the President and U.S. Secretary of Education Margaret
Spellings on the best use of scientifically based research to advance
the teaching and learning of mathematics. The report,
Foundations
for Success: Report of the National Mathematics Advisory Panel,
contains 45 findings and recommendations for improving mathematics
achievement for all U.S. students. Its numerous topics include
curricular content, learning processes, teachers and teacher education,
instructional practices, instructional materials, assessments, and
research policies and mechanisms.
Of particular relevance was the development of a list of major topics in school algebra (see p. 16) and the critical foundations in K-8 math education for algebra: whole numbers, fractions (including decimals, percents, and negative fractions), and aspects of geometry and measurement (see p. 17). "School algebra is a term chosen to encompass the full body of algebraic material that the Panel expects to be covered through high school, regardless of its organization into courses and levels. The Panel expects students to be able to proceed successfully at least through the content of Algebra II" (Executive Summary, p. xvii).
HOT: June 1, 2009:
Common Core State Standards Initiative: In its June 1
press release, the National Governors Association Center for Best Practices and the Council
of Chief State School Officers (2009) announced that
49
States and Territories Join the Common Core State Standards Initiative.
This initiative is "a state-led process to develop a common core of
state standards in English-language arts and mathematics for grades
K-12. These standards will be research and evidence-based,
internationally benchmarked, aligned with college and work expectations
and include rigorous content and skills" (para. 3). "The goal is to have
a common core of state standards that states can voluntarily adopt.
States may choose to include additional standards beyond the common core
as long as the common core represents at least 85 percent of the state’s
standards in English-language arts and mathematics" (para. 6). "The
grade-by-grade standards work is expected to be completed in December
2009" (para. 9). Learn more about the standards at
https://www.thecorestandards.org.
HOT: June 2009:
In connection with developing a common national curriculum and
assessment for K-12 mathematics, the National Council of Teachers of
Mathematics released its
Guiding Principles for Mathematics Curriculum and Assessment.
According to NCTM (2009a), "If a voluntary national mathematics
curriculum is developed, the topics studied in that curriculum must be
taught and learned in an equitable manner in a setting that ensures that
problem solving, reasoning, connections, communication, and conceptual
understanding are all developed simultaneously along with procedural
fluency" (p. 2). Content should include number and operations with
procedural fluency, algebra, geometry and measurement, data analysis,
statistics and probability.
In a critique of this document, Ihor Charischak of the Council for Technology in Math Education (CLIME) stated that there is nothing new in this latest document and what is missing is the role that technology should play. According to Charischak (2009), "I'm afraid that this common ground movement is making us think narrowly about what Math Ed should look like for students who will be living entirely in the 21st century. It may ease some political tensions, but it also may throw out the baby with the bathwater because it will lack the spirit of what technology brings to the enterprise: an exciting and transformational way to teach and learn mathematics" (CLIME Blogpost, What's Missing from This Picture?, June 3).
HOT: July 16, 2009:
In its July 16 press release,
Leading Education Associations Support Common Core State Standards
Initiative, the Learning First Alliance, a partnership of 17 major national education
associations, expressed its support for steps taken by the Common Core
State Standards Initiative to develop a common core of state K-12
standards in mathematics and English language arts.
HOT: September 21, 2009:
Revisions to the draft for a set of Common Core Standards were released
for language arts and mathematics. Sean Cavanaugh of Education
Week discussed some of the changes in
Revised Draft of 'Common Core' Standards Unveiled.
Among those for math is the addition of a new standard called
"mathematical practice," which refers to how students solve problems
(i.e., their thinking, strategies, and habits). For more
information on the Common Core Standards see
https://www.thecorestandards.org.
In their October 8, 2009, reaction,
Standards Aren't Enough, Susan H. Fuhrman, Lauren Resnick, and
Lorrie Shepard (2009) voiced a concern about common-core
standards, saying that "standards, no matter what they say, are
merely the starting point. Curricula, tests, textbooks, lesson plans,
and teachers’ on-the-job training will all have to be revised to
reinforce the standards. Only then will these new “common-core
standards” serve as the organizing principle for U.S. public education"
(para. 3).
HOT: October 6, 2009:
As a follow-up to its 2006 Curriculum Focal Points, NCTM released
Focus in High School Mathematics: Reasoning and
Sense Making, a "conceptual framework to guide the development of future
publications and tools related to 9–12 mathematics curriculum and instruction."
It highlights reasoning opportunities in numbers and measurements, algebraic
symbols, functions, geometry, statistics and probability (NCTM,
2009b). In its press release NCTM stated that this book "suggests practical changes
to the high school mathematics curriculum to refocus learning on reasoning and sense
making. This shift is not a minor refinement but constitutes a substantial rethinking of the
high school math curriculum" (NCTM, 2009c, para. 1). Reasoning habits
are organized into four broad categories: analyzing a problem, implementing a
strategy, seeking and using connections, and reflecting on a solution (NCTM,
2009a, FAQs, p. 4).
HOT: October 14, 2009:
Results are in for the
2009 National Assessment of Educational
Progress Nation's Report Card: Mathematics.
On October 14, 2009, the National Assessment Governing Board (NAGB) announced major results of the National Assessment of Educational Progress for the 2009 mathematics test. "There has been no significant change in the performance of the nation’s 4th-graders in mathematics from 2007 to 2009, a contrast to the progress seen from 1990 to 2007 at that grade level and subject, according to the 2009 National Assessment of Educational Progress (NAEP) in mathematics. But the 8th-grade mathematics score on the NAEP, which is also called The Nation's Report Card, continued to improve nationwide and reached its highest level since 1990" (NAGB News Release, para. 1).
The test was ""administered by the National Center for Education Statistics of the U.S. Department of Education to a nationally representative sample of 168,800 4th-grade and 161,700 8th-grade public and private school students. Results for representative samples of public school students only are also reported for each of the 50 states, the District of Columbia, and the Department of Defense schools" (NAGB News Release, para. 9). See full results at https://www.nationsreportcard.gov/math_2009/index_alt.aspx
HOT: December 8, 2009:
Results are in for the
Nation's Report Card: Mathematics 2009 Trial Urban District Assessment.
Eighteen urban districts participated in the 2009 Trial Urban District Assessment, according to this report from the National Assessment of Educational Progress. "Eleven of the districts also participated in the 2007 and 2005 assessments, and 10 participated in 2003. ... In comparison to 2007, average mathematics scores for students in large cities increased in 2009 at both grades 4 and 8; however, only two participating districts at each grade showed gains. In comparison to 2003, scores for students in large cities were higher in 2009 at both grades 4 and 8. Increases in scores were also seen across most urban districts that participated in both years, except in Charlotte at grade 4 and in Cleveland at grades 4 and 8, where there were no significant changes. No districts showed a decline in scores at either grade" (Description section posted at https://nces.ed.gov/pubsearch/pubsinfo.asp?pubid=2010452rev).
HOT: January 14,
2010:
Not everyone is in agreement with the Common-Core Standards movement.
For an alternative viewpoint, read Alfie Kohn's commentary,
Debunking the Case for National Standards. He stated, "The
standards movement, sad to say, morphed long ago into a push for
standardization. The last thing we need is more of the same" (last
paragraph). Additional reader comments follow.
HOT: June 2, 2010:
The National Governors Association Center for Best Practices and the
Council of Chief State School Officers released the final form for a set
of state-led education standards for K-12 English-language arts and
mathematics, the
Common Core State
Standards. Read the
key shifts for mathematics.
HOT: August 2011:
The Partnership for Assessment of Readiness for College
and Careers (PARCC) released its draft model content frameworks
for English language arts/ literacy and mathematics to help link the standards
to PARCC assessments and to provide greater
insight into the Common Core State Standards (CCSS).
PARCC's Model Content
Frameworks for Mathematics (October 2011) had detailed information for grades 3–8 and high school,
including the big ideas of the CCSS for each grade level and high
school, and three priority levels for instructional emphases by cluster
for addressing the standards. Note: The math framework was later
revised; see Version
5.0 of November 2017.
HOT: September 7, 2011:
The
Mathematics
Common Core Coalition was formed to "ensure the successful
communication, interpretation, implementation, and assessment of the
Common Core State Standards" (Mission statement section). There
are eight member organizations providing their expertise and advise on
issues.
HOT: November 1, 2011:
The
2011 National Assessment of Educational Progress Nation's Report Card
was released for mathematics.
"Nationally representative samples of about 209,000 fourth-graders and 175,000 eighth-graders participated in the 2011 National Assessment of Educational Progress (NAEP) in mathematics. At each grade, students responded to questions designed to measure their knowledge and abilities across five mathematics content areas: number properties and operations; measurement; geometry; data analysis, statistics, and probability; and algebra" (Summary of Major Findings section, para. 1). Among major findings: Students at grades 4 and 8 scored higher in 2011 than in previous assessments; A higher percentage of fourth- and eighth-graders performed at or above Proficient in 2011 than in 2009; There was a higher percentage of fourth- and eighth-graders who performed at or above Proficient in 2011 than in 2009 (Summary of Major Findings section).
See a summary report for each state or jurisdiction that participated in the NAEP assessments. Also see results noted in the "Classroom Context" section in which teachers responded to questions in four areas: their highest degree earned, time spent on mathematics, frequency for allowing use of calculators on tests and quizzes; and their emphasis on algebra and functions.
HOT: November 9, 2011:
The Partnership for Assessment of Readiness for College and Careers
(PARCC) released its October 2011
Model Content Frameworks for
Mathematics, Grades 3-11 to the public. Its purpose is "to serve as a bridge
between the Common Core State Standards and the PARCC assessments" (p. 4). Within the
document you will find guidance in several areas. Per PARCC (2011):
Note: The grades 3-11 math framework was later revised; see Version 5.0 of November 2017.
HOT: February 9, 2012:
Conference Board of the Mathematical
Sciences "an umbrella organization consisting of sixteen
professional societies all of which have as one of their primary
objectives the increase or diffusion of knowledge in one or more of the
mathematical sciences" released
The Mathematical Education of Teachers II.
This 2012 document was prompted by the Common Core
State Standards for Mathematics. It updates the first MET of 2001 with
"recommendations for the mathematical preparation of teachers of elementary
grades, middle grades, and high school." It has "recommendations for the
professional development of teachers of mathematics" and discusses "the
mathematical needs of elementary mathematics specialists, and of teachers in
early childhood education and special education" (Preface section).
The complete book and parts of the book are available at
https://www.cbmsweb.org/the-mathematical-education-of-teachers/
HOT: April 25, 2012:
The
Smarter Balanced Assessment Consortium and
Partnership
for Asssessment of Readiness for College and Careers
released guidance for the minimum hardware specifications for K-12
technology purchases that may be needed to ensure that schools are equipped
to deliver the Common Core online assessments.
There are some commonalities to those specifications in terms of hardware,
operating system, networking, and device type. Note: The link to
PARCC's version 7.0 for 2017-2018 is provided here.
HOT: May 2012:
From an announcement by Achieve.org,
Common Core Math Standards Implementation Can Lead to Improved Student
Achievement, we learn that "Dr. William Schmidt released key
conclusions from his research detailing how the Common Core State
Standards (CCSS) for mathematics can potentially improve the performance
of U.S. students if implemented appropriately" (para. 1).
Dr. Schmidt's work was entitled: Common Core State Standards Math: The Relationship Between High Standards, Systemic Implementation and Student Achievement. "Unlike previous research, Schmidt analyzed the link between states with standards that were similar to the CCSS and their NAEP [National Assessment of Educational Progress] math scores. He used cut scores aligned to NAEP as a proxy to determine if states were serious about high expectations and implementation of standards. The preliminary results showed states with standards in line with CCSS combined with higher cut scores also had higher NAEP scores" (para. 7).
HOT: July 20, 2012:
The writing team for the Common Core State Standards in mathematics
(CCSSM) finalized a set of guidelines "to support
faithful CCSSM implementation by providing criteria for materials
aligned to the Common Core State Standards for Mathematics" (p. 1).
While meant for publishers, the document,
K-8 Publishers' Criteria for
the Common Core State Standards for Mathematics, will be valuable to
school districts in reviewing previously purchased materials and tools,
and for educators to review their existing teacher-developed materials
and to develop new materials aligned to the standards, and for providing professional
development. The 24-page document, free for download, has three
sections:
HOT: August 20, 2012:
PARCC released sample test items and performance tasks for the Common Core State Standards in
mathematics. [Find
released test items
at New Meridian, which took over management of PARCC's testing business in 2017. See:
PARCC Agent Rolling Out Pool of Items for Custom State Assessments
by Dian Schaffhauser, December 6, 2018.]
HOT: December 2012:
The
TIMSS 2011 International Results in Mathematics was
released. It was authored by Mullis, I.V.S., Martin, M.O., Foy, P., & Arora, A. (2012), Chestnut
Hill, MA: TIMSS & PIRLS International Study Center, Boston College.
It summarizes fourth and eighth grade student achievement in each of the
63 countries and 14 benchmarking entities which participated in TIMSS
2011. https://timss.bc.edu/
HOT: February 2013:
Horizon Research, Inc. released
The Report of the 2012 National Survey of Science and Mathematics Education,
which "details the results of a survey of 7,752 science and mathematics
teachers in schools across the United States. Areas addressed include:
teacher backgrounds and beliefs, teachers as professionals, science and
mathematics courses, instructional objectives and activities,
instructional resources, and factors affecting instruction." The
entire report or selected chapters can be downloaded. The
following are among the multiple conclusions:
"[S]cience and mathematics teachers, especially in the elementary and middle grades, do not have strong content preparation in their respective subjects ... A large majority of teachers in all subject/grade-range categories believe that it is better to cover fewer topics in depth. However, many believe that students should be given definitions for new vocabulary at the beginning of instruction, that teachers should explain an idea to students before having them consider evidence for it" (pp. 31-32), and that "hands-on activities should be used primarily to reinforce ideas students have already learned, despite recommendations that these be used to help students develop their initial understanding of key concepts" (p. 32).
"Workshops are the most prevalent form of professional development, and participation in teacher study groups is also quite common. ... The emphasis of these professional development opportunities ... has largely been on planning instruction to enable students at different levels of achievement to enhance their understanding, monitoring student understanding during instruction, and assessing student understanding at the end of instruction on a topic. Learning how to use hands-on/manipulatives has also been focused on heavily in mathematics professional development, especially at the elementary level" (pp. 50-51).
"In mathematics, although most middle schools offer Algebra 1, relatively few students complete it prior to 9th grade" (pp. 66-67).
"Explanation of ideas and whole group discussion are also very prominent in mathematics instruction, as is the use of textbook/worksheet problems. Having students engage in practices consistent with the Common Core State Standards for Mathematics, such as explaining and justifying methods for solving a problem and comparing/contrasting different solution methods, is also a common weekly occurrence across grade ranges, although the frequency of use decreases as grade range increases. For example, 78 percent of elementary classes have students consider multiple representations in solving a problem at least once per week, compared to only 65 percent of high school classes. Similar to science, the use of technology in mathematics instruction is fairly low across grade levels" (p. 89).
"Across both science and mathematics, the same three publishers dominate [Houghton Mifflin Harcourt, McGraw-Hill, and Pearson], accounting for at least 75 percent of the market at each level. ... more than 70 percent of teachers in both subjects rate their textbooks as good or better. ... Textbooks appear to exert substantial influence on instruction, from the amount of class time spent using the textbook (especially in mathematics) to the ways teachers use them to plan for and organize instruction. At the same time, it is clear that teachers deviate from their published materials substantially, both skipping parts of the text (most often because teachers know of something better) and supplementing with other materials (most often to provide additional practice or to differentiate instruction)" (p. 107).
"In mathematics, only two factors are seen as a serious problem in a substantial proportion of schools: low student interest in the subject and low student reading abilities. Lack of student interest is more likely to be seen as a serious problem in middle and high schools than in elementary schools" (p. 116).
"[T]he use of special instructional arrangements—e.g., subject matter specialists or pull-out instruction for enrichment and/or remediation—is much more prevalent in mathematics than in science, perhaps because of accountability pressures associated with mathematics. The availability of federal funds for mathematics instruction probably also plays a role. ... [P]rograms to encourage student interest in mathematics are strikingly uncommon. For example, less than one-third of schools offer mathematics clubs. ... In mathematics, the substantial influence of state standards is evident in multiple ways, among them school-wide efforts to discuss and align instruction with standards" (p. 125).
HOT: June 27, 2013:
The National Assessment of Educational Progress
Nation's Report Card: Trends in Academic Progress 2012
was released. This report is on long-term trend
assessments in reading (1971-2012) and mathematics (1973-2012) and "is based on the performance
of nationally representative samples of 9-, 13-, and 17-year-olds
attending public and private schools. Over 17,000 students at each age
were assessed in either reading or mathematics during the 2011-2012
school year. ... The assessments provide a unique opportunity to
look back on student performance across more than four decades."
Among trends of note: "Both 9- and 13-year-olds scored higher in reading
and mathematics in 2012 than students their age in the early 1970s.
Average reading and mathematics scores in 2012 for 17-year-olds were not
significantly different from scores in the first assessment year" (Summary of Major Findings section).
HOT: July 2013:
The Partnership for Assessment of Readiness for College and Careers (PARCC) released its
Contents of the Grade- and Subject-Specific Performance Level Descriptors
(PLDs) in Mathematics.
A 2013 PowerPoint presentation is available to explain the structure of
the PLDs. "The PLDs are rubrics indicating the broad categories
that will be used to report learner performance on an assessment.
Five levels of command include 5: Distinguished, 4: Strong, 3: Moderate,
2: Partial Command, or Level 1 indicating a range from
no work shown to Minimal command." PARCC also released its
Accessibility Features and Accommodations Manual (updated July 25,
2013). [Note: PARCC's Math Performance Level Descriptors and names for
performance levels 1-5 were later revised in 2015. See the updates
in
https://files.eric.ed.gov/fulltext/ED582072.pdf]
HOT: September 2013:
The Smarter Balanced Assessment Consortium (SBAC) adopted its
Usability, Accessibility, and Accommodations Guidelines that outline
the kinds of testing supports and tools that will be made available to
all students, and particularly those with disabilities and
English-language learners for the Common Core assessments. The Governing
States of the SBAC voted to approve the guidelines on September 11,
2013. See the updates for
Accessibility and Accommodations.
HOT: November 2013:
The
2013 National Assessment of Educational
Progress Nation's Report Card: Mathematics and Reading was
released. The report indicates students in grades 4 and 8 are
making progress. Per the
Executive Summary,
"Nationally representative samples of more than 376,000 fourth-graders
and 341,000 eighth-graders were assessed in either mathematics or
reading in 2013. Results are reported for public and private school
students in the nation, and for public school students in all 50 states,
the District of Columbia, and Department of Defense schools." Data
revealed:
HOT: January 2014:
In its news release of January 15, 2014, the
California Department of Education announced it has
adopted mathematics
programs aligned to the Common Core Standards. The
list of 31 programs from major publishers can be viewed online and are
grouped into three categories: basic grade-level (n=20), algebra I
(n=10), and mathematics 1 (n=1). Such programs might assist other
states in locating programs of interest for their learners.
HOT: September 1, 2014:
The Education Commission of the States released its report on the Common
Core Standards,
States and the (not so) new standards — where are they now?
by Tonette Salazar and Kathy Christie. "This brief provides a sampling of
state legislative activity and executive branch action around the CCSS through Sept. 1, 2014. It is not intended to
be an exhaustive list; rather, it is narrowly focused on the single issue of
state affirmation, modification or replacement of the Common Core" (para.
2). Within the Appendix are state names for Common Core Standards.
HOT: July 2015:
First released in August 2011, the SMARTER Balanced Assessment Consortium released
its revised draft dated July 2015:
Content Specifications for the Summative Assessment
of the Common Core State Standards for Mathematics. The
document describes the evidence students must exhibit to demonstrate
mastery of the college- and career-ready knowledge and skills identified
in the Common Core State Standards for Mathematics.
HOT: April 27, 2016:
The
2015 National Assessment of Educational
Progress Nation's Report Card: Per the
Overview of results
for grade 12 mathematics, "In 2015, twelfth-grade students had an average score of 152 on the
NAEP 0–300 mathematics scale. This was lower compared to the average score
[153] in 2013, but was not significantly different in comparison to 2005. No significant
change from 2013 was seen in the average mathematics score for any
racial/ethnic group. For male and female students and for
twelfth-grade students attending public schools, the average score
in 2015 was lower compared to 2013. Approximately 13,200 students took the NAEP mathematics assessment
in 2015. The results of their performance are compared to 2013,
2009, and 2005, which is the first trend year for mathematics
because of changes made to the assessment framework." See the
April 27, 2016
remarks on results from Dr. Peggy Carr, Acting Commissioner of the
National Center for Education Statistics.
HOT: June 23, 2016:
The Thomas B. Fordham Institute released
Common Core Math in the K-8 Classroom: Results from a National Teacher
Survey, authored by Jennifer Bay-Williams, Ann Duffett, and David
Griffith. Their analysis was "based on an online survey of a
representative sample of 1,003 K–8 public school math teachers from the
forty-three states (as well as the District of Columbia) that had adopted
and retained the Common Core State Standards for Mathematics as of March
2015" (p. 8). The following are among findings:
In terms of content being taught, "Across all grades, thirty-seven of the forty-four “major” topics included in the survey were identified by at least 90 percent of teachers (from the appropriate grades) as among those they teach. Most teachers are not neglecting computation, though many report having fewer students who memorize basic math formulas or multiplication tables" (p. 9). The reason for fewer students memorizing was unclear.
In terms of instructional practices being used, "65 percent of both K–2 and 3–5 teachers and 41 percent of 6–8 teachers report that they are “teaching multiple methods to solve a problem” more often than they did before the CCSS-M were implemented." ... However, "53 percent overall agree that “students are frustrated because they are being asked to learn many different ways to solve the same problem.” " (p. 10). Teachers (64%) are more often "requiring students to use writing to explain their thinking" and they (55%) are devoting more attention to "requiring students to use proper math vocabulary" (p. 31). Other practices include an increase in the use of the number line "consistent with a host of standards in grades 2–8" as reported by 37% of teachers. Although not addressed in the CCSS-M, teachers (32%) reported using games and other student directed activities more; 40% reported using drill and flash cards less (p. 11).
In terms of teacher views on the impact of CCSS on students' math preparation, most teachers believe students are developing better number sense and more ability to apply math in real-world applications. However, teachers "were divided over students ability to perform simple calculations" (p. 12). "The 18 percent of respondents who primarily teach students who are remedial or significantly below grade level in math evince significantly more pessimism about the impact of CCSS-M on students than teachers who primarily teach on-grade-level students" (p. 13). Teachers view the CCSS-M as a source of stress for students; yet a majority (53%) "think the CCSS-M will have long-term benefits for students" for the "advanced math needed to succeed in selective colleges or as STEM majors" (p. 13).
The report also addresses curricular materials being used, and recommendations such as advice for involving families.
HOT: July 2016:
The Institute of Education Sciences released its
Synthesis of IES-Funded Research on Mathematics: 2002–2013.
The report lists 28 ways that federally funded research during this time
period contributed to what we know on how to teach mathematics and
approaches to professional development. Almost 200 federally funded
studies about math learning and teaching were analyzed. The
report is organized into two sections: 1. Whole Numbers,
Operations, and Word Problem Solving in Elementary School (10 contributions), and
2. Fractions and Algebra in Middle School (14 contributions). The report revealed 4
contributions related to professional development approaches.
HOT: November 13, 2017:
Achieve, Inc. released a report,
Strong
Standards: A Review of Changes to State Standards Since the Common Core.
Twenty-four of the 45 states and the District of Columbia that adopted
the CCSS in 2010 have revised their English Language Arts and Math
standards, largely due to political influences or "associated opposition
to testing and accountability policies." However, Achieve's
analysis of those 24 states revealed that "most
states kept their standards rigorous and maintained college- and
career-ready expectations for students."
HOT: April 2018:
The 2017 National Assessment of Educational Progress Nation's Report Card
was released for mathematics and reading for grades 4 and 8. National
results for mathematics were "flat overall."
Per its mathematics summary, "NAEP mathematics scores are reported on a scale of 0–500. Scores are reported as a national average at grades 4 and 8. Findings were reported based on "five selected percentiles to show the progress made by lower- (10th and 25th percentiles), middle- (50th percentile), and higher- (75th and 90th percentiles) performing students."
"Compared to 2015, there was no significant change in the average score for mathematics at either grade. Scores were higher than those recorded in 1990, the first year of the assessment."
In more detail when compared to performance in 2015, findings revealed that scores in mathematics decreased for lower-performing grade 4 students, those performing at the 10th and 25th percentiles. Performance also decreased for lower-performing grade 8 students at the 25th percentile. However, scores increased for higher-performing grade 8 students, those performing at the 75th and 90th percentiles. There were no significant changes in math scores for either grade 4 or grade 8 middle level performers, those at the 50th percentile.
Note: Caution should be exercised in considering the implications of results, as concerns have been raised regarding using computers for test-administration. As noted in The Hechinger Report (Barshay, 2018, April 10): "The 2017 NAEP was the first time a majority of students across the nation took the test on a computer, instead of with pencil and paper" (Concerns over computers section). A student's computer skills may have affected performance on the test.
HOT: April 25, 2018:
The National Council of Teachers of Mathematics called for major changes in
high school mathematics in its publication,
Catalyzing Change in High
School Mathematics, Initiating Critical Conversations. The
executive summary is available. Per its
news release (p. 2), NCTM recommends:
HOT: August 22, 2018:
The Thomas B. Fordham Institute released
The State of State Standards Post-Common Core, which "focuses on those
[states] that have made the most substantive changes to the Common Core, or that
never adopted them in the first place. ...Specific recommendations for all of
these states, as well as broader guidance for the majority of states that have
kept the Common Core and a detailed discussion of recent trends in ELA and math
standards, can be found in the report." ELA standards in 14 states and
math standards in 10 states are reviewed.
HOT: March 11, 2019:
In its press release,
Study finds curriculum alone
does not improve student outcomes, Harvard University stated:
"In recent years, education leaders have hailed curriculum choice as a low-cost way to improve student success. But in the first multi-state effort to measure textbook efficacy since the implementation of the Common Core, researchers at the Center for Education Policy Research (CEPR) at Harvard University saw no difference in the average fourth- and fifth-grade math achievement gains of schools using different elementary math textbooks. At current levels of curriculum usage and professional development, textbook choice alone does not seem to improve student achievement" (para. 1). The study, Learning by the Book, involved a sample of almost 6,000 schools and over 1,200 teachers across six states.
HOT: October 30, 2019:
The
2019 National
Assessment of Educational Progress Nation's Report Card was released.
Per the report, "Approximately 296,900 students across the nation participated
in the 2019 mathematics assessment. Results are compared to those from 2017 and
the previous mathematics assessments back to the 1990s. ... In 2019, average mathematics
scores for the nation were 1 point higher at grade 4 and 1 point lower at grade 8 than in 2017."
HOT: October 14, 2021:
Results of the 2020 NAEP (National
Assessment of Educational Progress) Long Term Trends in Reading and Mathematics
Assessments at ages 9 and 13 were released. Per the news release (p. 2):
HOT: October 24, 2022:
The
2022 National
Assessment of Educational Progress Nation's Report Card was
released. Per the report, "In 2022, the average fourth-grade mathematics
score decreased by 5 points and was lower than all previous assessment years
going back to 2005; the average score was one point higher compared to 2003. The
average eighth-grade mathematics score decreased by 8 points compared to 2019
and was lower than all previous assessment years going back to 2003. In 2022,
fourth- and eighth-grade mathematics scores declined for most
states/jurisdictions as well as for most participating urban districts compared
to 2019. Average scores are reported on NAEP mathematics scales at grades 4 and
8 that range from 0 to 500."
HOT:
March 2023:
Mathematicians Excited About New 13-Sided Shape Called 'the Hat'
(2023).
In March 2023, Kevin Hurler at gizmodo.com reported that "Researchers [mathematician David Smith and colleagues] identified a shape that was previously only theoretical: a 13-sided configuration called “the hat” that can tile a surface without repeating. The hat is what’s known as an aperiodic monotile, which means that a single shape can tile a surface without any translational symmetry, or without its pattern ever repeating." (para. 1-2)
So what does it look like?
"The 13-sided hat is a polykite shape, consisting of eight kites [highlighted in gray in the image] connected at their edges."
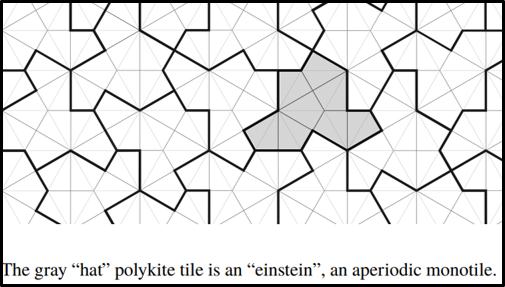
Image source: David Smith et al.
Smith, D., Myers, J., Kaplan, C., & Goodman-Strauss, C. (2023, March 20). An aperiodic monotile [Preprint]. https://arxiv.org/pdf/2303.10798.pdf
HOT: February 2024:
The National Council of Teachers of Mathematics
(NCTM) released its position on
Artificial Intelligence and Mathematics Teaching.
Its position on the use of AI refers to "technologies derived
from generative AI machine learning approaches (e.g., ChatGPT, Bard, etc.)"
(Defining Terms section). Key takeaways: Although generative AI has the potential to
personalize learning and streamline teaching tasks, "AI tools do not replace
the need to teach math or problem solving." AI output might include
biased data, hallucinations (untrue or unreaonable results), and inaccurate
citations, making it important for educators to tell students to be skeptical of results
and to teach them how to verify results. Further, use of such tools requires
math educators to have deeper knowledge about instruction and assessment techniques.
They also "need to be involved in developing and testing AI tools in math
education to stay up to date with current AI trends to best prepare students
for an AI future." All this requires "math teachers with more
experience, not less."
2024:
The report of the
Trends in International Mathematics and Science Study (TIMSS): 2023 U.S. Results
from the U.S. Department of Education, National Center for Education
Statistics "provides data for 63 education systems at the 4th-grade level
and 45 education systems at the 8th-grade level. ... TIMSS 2023 marks the
first opportunity to see changes in TIMSS trends among participating
education systems follarowing the COVID-19 pandemic. In mathematics,
U.S. 4th- and 8th-graders scored lower, on average, in 2023 than they did in
2019 (by 18 and 27 points, respectively)."
However, "In 2023, the United States performed above the TIMSS 2023 international average in mathematics and science at both the 4th and 8th grades. Male students scored higher than female students in both grade levels and subjects in the United States." You can learn more about the nature of this study and results at the site. Readers might also be interested in Jill Barshay's 6 observations from a devastating international math test, a Hechinger Report (2024, December 16), which she formed after interviewing testing experts. In spite of the TIMMS 2023 results showing "fewer U.S. students in the middle, a re-emergent gender gap," there is "a silver lining."
HOT: January 28, 2025:
The
2024 National
Assessment of Educational Progress Nation's Report Card was
released. Per the results for the mathematics assessment, "In 2024,
the average score at fourth grade was 2 points higher compared to 2022 and 3
points lower compared to the pre-pandemic score in 2019. Compared to 2022,
the score increased for middle-performing students at the 50th percentile
and for higher-performing students at the 75th and 90th percentiles; there
were no significant score changes for lower-performing students at the 10th
and 25th percentiles. The average score at grade 4 was higher compared to
the first assessment in 1990."
Further, "In 2024, the average score at eighth grade was not significantly different from 2022 but was 8 points lower compared to 2019. Although the average score in 2024 did not significantly change compared to 2022, scores increased for higher-performing students at the 75th and 90th percentiles, while scores decreased for lower-performing students at the 10th and 25th percentiles. The average score at grade 8 was higher compared to the first assessment in 1990."
January 7, 2005:
The U.S. Department of Education released a
National Education Technology Plan: Toward a New Golden Age in
American Education: How the Internet, the Law and Today's Students are
Revolutionizing Expectations (2005). The plan highlights seven action steps with
accompanying recommendations for states, districts, and individual schools:
- This action includes among recommendations to "[p]rovide every student access to e-learning" and to "[e]nable every teacher to participate in e-learning training."
- This action includes among recommendations to "move away from reliance on textbooks to the use of multimedia or online information" and to consider the costs and benefits of online content, "aligned with rigorous state academic standards, as part of a systemic approach to creating resources for students to customize learning to their individual needs."
- The plan stresses, "Integrated, interoperable data systems are the key to better allocation of resources, greater management efficiency, and online and technology-based assessments of student performance that empower educators to transform teaching and personalize instruction." This action step also recommends leadership to ensure interoperability by considering School Interoperability Framework (SIF) Compliance Certification as a requirement in all RFPs and purchasing decisions.
February 17, 2009:
The American Recovery and Reinvestment Act (ARRA) was signed into law by
President Barack Obama on February 17, 2009. The goal of this economic
stimulus package was saving and creating jobs and reforming education.
Read about the law at
https://obamawhitehouse.archives.gov/administration/eop/sicp/initiatives/recovery-act.
March 5, 2010:
The U.S. Department of Education released a draft for a
National Education
Technology Plan: Transforming American
Education: Learning Powered by Technology (2010). The plan presents
a model of 21st century learning powered by technology, with goals and
recommendations in five essential areas: learning, assessment, teaching,
infrastructure, and productivity:
March 17, 2010:
The Federal Communications Commission released
Connecting America: The National
Broadband Plan. The FCC's plan recommends
"changes to the E-rate program—which offers schools and libraries
discounted telecommunications services, Internet access and internal
connections to improve the broadband infrastructure available to
schools" (p. 236). The report is extensive. Sections related to
Education include supporting and promoting online education, unlocking
the power of data and improving transparency, and modernizing
educational broadband infrastructure.
May 4, 2010:
The Obama administration released a series of documents
outlining the research that supports the proposals in the
blueprint for
revising the Elementary and Secondary Education Act (ESEA). The
blueprint released March 13, 2010, included the following sections:
November 2010:
The U.S. Department of Education released the final version of the
National Education
Technology Plan: Transforming American
Education: Learning Powered by Technology
(2010). In his letter to the members of Congress, Secretary of Education Arne Duncan stated:
The model of learning described in this plan calls for engaging and empowering personalized learning experiences for learners of all ages. The model stipulates that we focus what and how we teach to match what people need to know and how they learn. It calls for using state-of-the-art technology and Universal Design for Learning (UDL) concepts to enable, motivate, and inspire all students to achieve, regardless of background, languages, or disabilities. It calls for ensuring that our professional educators are well connected to the content and resources, data and information, and peers and experts they need to be highly effective. And it calls for leveraging the power of technology to support continuous and lifelong learning. (Nagel, 2010, p. 1)
February 6, 2013:
In an ISTE blog post,
Great Start for Digital Learning Policy in the 113th Congress: Comprehensive
Education Technology Bill Introduced in House of Representatives, Hilary
Goldman reported that on this date, "George Miller (D-CA), the senior Democrat
on the House Education and the Workforce Committee introduced the Transforming
Education through Technology Act. The introduction of this legislation is an
important milestone in digital learning policy. With no dedicated federal
funding over last few years for classroom technology, and the reauthorization of
the Elementary and Secondary Education Act stalled, the Transforming Education
through Technology Act will be a rallying opportunity for the entire education
community to highlight and underscore the key role digital learning plays in all
aspects of teaching and learning to ensure all students are college and career
ready" (para. 1). Track this bill at
https://www.govtrack.us/congress/bills/113/hr521 Ultimately, it was
not enacted.
July 2013:
The National Education Association released its
NEA Policy Statement on Digital
Learning. Highlights include:
"The appropriate use of technology in education—as defined by educators rather than entities driven by for-profit motives—will improve student learning, quality of instruction, and education employee effectiveness, and will provide opportunities to eradicate educational inequities."
"It is of critical importance that the use of technology is recognized as a tool that assists and enhances the learning process, and is not the driver of the digital learning plan. These plans also should include the provision of adaptive technologies to meet individual students’ needs, including assistive technology to support students who are English Language Learners and students with a variety of disabilities or challenges."
"All educators—pre-k12 and postsecondary teachers, ESPs, and administrators—are essential to student learning and should have access to relevant, high-quality, interactive professional development in the integration of digital learning and the use of technology into their instruction and practice."
"...education employees should own the copyright to materials that they create in the course of their employment."
"Optimal learning environments should neither be totally technology free, nor should they be totally online and devoid of educator and peer interaction. The Association believes that an environment that maximizes student learning will use a “blended” and/or “hybrid” model situated somewhere along a continuum between these two extremes."
"Teachers should be fully qualified, certified, and/or licensed to teach the subjects they are teaching, including in online instructional settings."
"Technology is a tool to enhance and enrich instruction for students, and should not be used to replace educational employees who work with students or limit their employment."
October 8, 2015:
Per the press release of October 8, 2015, from the Committee on Science, Space, & Technology,
President Obama signed into law the STEM Education Act of 2015 (H.R. 1020).
The Act strengthens Science, Technology, Engineering, and Math Education (STEM)
and expands the definition of STEM to include computer science.
The STEM Education Act of 2015 directs the National Science Foundation (NSF) to continue to award competitive merit-reviewed grants to support informal STEM education. Informal education is work that takes place outside of the classroom at places like museums, science centers and afterschool programs. These types of efforts engage students in STEM subjects and fields in ways that formal classroom training often does not. (Smith’s STEM Education Act Signed Into Law Press Release, 2015, para. 4)
January 2017:
The U.S. Department of Education released the
National Education Technology
Plan: Reimagining the Role of Technology in Education: 2017 National
Education Technology Plan Update.
"The principles and examples provided in this document align to the
Activities to Support the Effective Use of Technology (Title IV) Part A
of the ESEA, as amended by ESSA" (About This Plan section,
p. 3). The plan includes five sections elaborating on technology for
learning, teaching, assessment, leadership, and the infrastructure. Note:
This plan first released in December 2015 was updated January 2017.
September 2022:
The U.S. Department of Education's Office of Education Technology released
Advancing Digital Equity for All: Community-Based
Recommendations for Developing Effective Digital Equity Plans to
Close the Digital Divide and Enable Technology-Empowered Learning.
The document provides "guidance on equitable broadband access, with
particular emphasis on adoption, to support leaders in building
their digital equity plans" (p. 19). The report elaborates on
three components of access: availability, affordability, and
adoption and addresses barriers and strategies within the following questions:
January 25, 2023:
Roberto Rodriquez, Assistant Secretary in the Office of Planning, Evaluation,
and Policy Development of the Office of Educational Technology, released a
Dear
Colleague Letter: Leveraging Federal Funds for Teaching and Learning with
Technology. It "provides some examples of how funds under Titles I
through IV of the Elementary and Secondary Education Act of 1965 (ESEA) and the
Individuals with Disabilities Education Act (IDEA) may support the use of
technology to improve instruction and student outcomes" (p. 2).
For example, funds can be used for "(1) improving and personalizing professional learning and other supports for educators; (2) increasing access to high-quality digital content and resources for students; (3) facilitating educator collaboration and communication; and (4) providing devices for educators and students to access digital learning resources" (p. 2). The letter also includes sets of questions for selecting educational technology strategies (i.e., Systems, Models, Platforms, and Tools). They "help support decision-making related to the critical areas of needs assessment, policy and infrastructure, alignment with instructional approach, professional learning, and evidence" (p. 4).
May 2023:
U.S. Department of Education Office of Educational Technology released its
policy report,
Artificial
Intelligence and the Future of Teaching and Learning: Insights and
Recommendations. Per the website, the report "addresses the
clear need for sharing knowledge, engaging educators, and refining
technology plans and policies for artificial intelligence (AI) use in
education. The report describes AI as a rapidly-advancing set of
technologies for recognizing patterns in data and automating actions,
and guides educators in understanding what these emerging technologies
can do to advance educational goals—while evaluating and limiting key
risks."
January 2024:
The U.S. Department of Education released the
National Educational Technology
Plan: A Call to Action for Closing the Digital Access, Design and Use
Divides (2024). The plan has 113 pages and includes
recommendations for closing each divide and examples of schools that
have addressed each divide along with examples of programs or products
they use.
HOT: March 6, 2024:
The ILO Group released its
Framework for Implementing Artificial Intelligence (AI) in K-12 Education.
This 30-page document has two parts. Part 1 addresses District-wide AI
Areas of Consideration (Political, Operational, Technical, Fiscal). Part 2
includes Department-Specific AI Applications (Risk Profiles and
Department-Specific Examples). Risk profiles include the potential for
inaccurate communications, bias, and misuse of personal information. There
are potential technological and operational risks, eductional and pedagogical
risks, and legal and compliance risks. Within department-specific
applications, there are curriculum and instruction and special education
examples, and more.
HOT: June 26, 2024:
The
National Education Association released its policy statement on Artificial
Intelligence in Education (2024, June 26). The full report also
includes the benefits of using AI in teaching and learning. The policy addresses
five pinciples:
July 2024:
International Society for Technology in Education (ISTE)
Standards for 2024 were released for students, educators, administrators,
coaches, and computer science educators. These technology
standards reflect the impact of AI. Read about the need for
changes and what's new in the standards in Carolyn Sykora's blog post:
A new approach to updating the ISTE standards (2024, August 2).
HOT: September 11, 2024:
The State Educational Technology Directors Association (SETDA) released its
2024 State EdTech
Trends survey and report. Survey responses were gathered from
policy makers in 46 states and the Department of Defense Education Activity
(DoDEA). Key findings revealed:
October 2024:
U.S. Department of Education Office of Educational Technology released
Empowering Education Leaders: A Toolkit for Safe, Ethical, and Equitable AI
Integration, which builds on its May 2023 policy report. This 74-page AI
toolkit is divided into three sections: Mitigating Risk: Safeguarding
Student Privacy, Security, and Non-Discrimination (Modules 1-3); Building a
Strategy for AI Integration in the Instructional Core (Modules 4-7); and
Maximizing Opportunity: Guiding the Effective Use and Evaluation of AI (Modules
8-10).
 The
purpose of the No Child Left Behind Act of 2001 (NCLB) was to "close the
achievement gap with accountability, flexibility, and choice, so that no child
is left behind" (107th Congress, Public Law 107-110, 2002, 115 STAT. 1425).
It required states to assess students in math and reading each year in grades
3-8 and once during grades 10-12 to ensure that they were meeting grade-level
content and achievement standards.
The
purpose of the No Child Left Behind Act of 2001 (NCLB) was to "close the
achievement gap with accountability, flexibility, and choice, so that no child
is left behind" (107th Congress, Public Law 107-110, 2002, 115 STAT. 1425).
It required states to assess students in math and reading each year in grades
3-8 and once during grades 10-12 to ensure that they were meeting grade-level
content and achievement standards.
States were to have annual math and reading assessments in place by 2005-06. Until then they were required to administer reading and math assessments at least once during grades 3-5, 6-9 and 10-12. States were required to begin testing in science once in grades 3-5, 6-9, and 10-12 beginning in the 2007-08 school year. They were also to participate in the National Assessment of Education Progress (NAEP) in math and reading for grades 4 and 8. A sample of students statewide were to be used.
January 8, 2002:
President George W. Bush signed into law the No Child Left
Behind Act of 2001, called in its press release "a historic new law that will
change the culture of America's schools and, most important, improve student
achievement in classrooms across the country" (para. 1). Find out what
this landmark legislation meant for your state:
http://web.archive.org/web/20031011172530/http://www.ed.gov/news/pressreleases/2002/01/01082002.html
June 11, 2002:
U.S. Secretary of Education
Paige Releases a Report to Congress that Calls for Overhaul of State Teacher
Certification Systems. The No Child Left Behind Act called for highly
qualified teachers demonstrating subject matter knowledge to be in place in
every classroom by the end of the 2005–06 school year. According to this
release, "To raise academic standards, the report calls on states to require
prospective teachers to pass rigorous exams in the subjects they plan to teach.
Research shows that teachers with strong academic backgrounds in specific
content areas are more likely to boost the academic performance of their
students in those subjects." The report also calls for institutions with
teacher preparation programs to eliminate many of the rigid certification
requirements, such as an extensive number of methods courses, and it examines
successes in alternate routes to teaching. Read this report:
U.S. Department of Education, Office of Postsecondary Education, Office of Policy Planning and Innovation. (2002). Meeting the Highly Qualified Teachers Challenge: The Secretary's Annual Report on Teacher Quality. Washington, D.C. https://files.eric.ed.gov/fulltext/ED513876.pdf
June 10, 2003:
Approved State Accountability Plans:
Every state has submitted an accountability plan to the U.S. Department
of Education for ensuring that students are proficient in reading and
math by 2013-2014. Each received a letter noting actions required
to become fully approved. View the updated state plans:
https://web.archive.org/web/20231015062027/https://www2.ed.gov/admins/lead/account/stateplans03/index.html
August 18, 2003:
Phi Delta Kappan, the professional journal for
educators, posted results of the 35th Annual Phi Delta Kappa/Gallup Poll of the
Public's Attitudes Toward the Public Schools. Conclusions reached
by authors, Lowell C. Rose and Alec M. Gallup, include that, "The public sees
itself as uninformed on the No Child Left Behind (NCLB) Act, with 69% saying
they lack the information needed to say whether their impression of the act is
favorable or unfavorable. Forty percent say they know very little about the
NCLB, with an additional 36% saying they know nothing at all about the act."
However, "Responses to questions related to strategies associated with NCLB
suggest that greater familiarity with the law is unlikely to lead to greater
public support." The report is available at
https://journals.sagepub.com/doi/abs/10.1177/003172170308500113
In The Politics of No Child Left Behind, Andrew Rudalevige, assistant professor of political science at Dickinson College, detailed the context of NCLB and its evolution through Congress. He stated, "No Child Left Behind was the cumulative result of a standards-and-testing movement that began with the release of the report A Nation at Risk by the Reagan administration in 1983" (2003, online, para. 2).
February 23, 2005:
A special task force of the National Conference of State
Legislatures released the results of a 10-month study, No Child Left Behind Task Force Final Report,
in which they identified key areas of NCLB that need to be changed so that all
learners can reach their potential. See Key Recommendations from the NCSL
Task Force on No Child Left Behind (NCLB) Final Report at
https://web.archive.org/web/20210416152635/https://www.ncsl.org/documents/educ/NCLBRecommendations.pdf
Selected recommendations below from this 6-chapter report are quoted from the
Executive Summary:
Chapter 1: The Role of the Federal Government in Education Reform:
Congress should create a revitalized state-federal partnership that acknowledges diversity among states and shifts focus from processes and requirements to outcomes and results.
Chapter 2: Adequate Yearly Progress:
Chapter 3: AYP: Students with Disabilities and Limited English Proficiency:
Chapter 4: Flexibility for States to Address Unique Schools and Districts
Delegate flexibility authority in Section 9401 to states to allow to allow them to respond to the unique conditions of urban and rural communities.
Chapter 5: Highly Qualified Teacher and Paraprofessional Requirements
Allow states to establish conditions under which exceptions could be granted to the highly qualified teacher provisions.
Chapter 6: The Cost of Closing the Achievement Gap: Compliance vs. Proficiency
Substantially increase federal funding for the law. [The report notes that the federal government has dramatically increased spending on education since passage of NCLB, but the federal government's current share of education funding is only about 8 percent.]
 According to Susan Brookhart (2009), there are many ways to define and apply
the concept of "multiple measures."
According to Susan Brookhart (2009), there are many ways to define and apply
the concept of "multiple measures."
First, one needs to know what counts as a measure. " 'Multiple measures' describes at least three different ways of using more than one score: (1) measures of different constructs, (2) different measures of the same construct, and (3) multiple opportunities to pass the same test" (p. 9).
Second, one needs to know how multiple measures might be combined. Brookkart noted three ways: "Methods of combining information from multiple measures include (1) conjunctive, in which the student or group must pass all measures; (2) compensatory, in which higher performance on one measure can compensate for lower performance on another; and (3) complementary, in which the student or group must achieve the standard on just one of the multiple measures" (Chester, 2005, cited in Brookhart, 2009, p. 10).
Putting those three ways to define multiple measures together with the three ways to combine those yields nine different combinations.
Read The Many Meanings of "Multiple Measures" in Educational Leadership, volume 67, number 3, pages 6--12, November, 2009.
August 3, 2005:
The U.S. Department of Education issued
Highly
Qualified Teachers: Improving Teacher Quality State Grants,
revised
non-regulatory guidance to help state and local educational agencies meet
NCLB's teacher quality goals. "This Non-Regulatory Guidance explains how
State educational agencies, local educational agencies, and State agencies for
higher education can effectively use Title II, Part A funds to ensure that all
teachers are highly qualified and effective, a critical component of the No
Child Left Behind Act and the Individuals with Disabilities Education Act" (Purpose of this Guidance
section, para. 1). The document also includes clearer
answers to the definition of a highly-qualified teacher, what is meant my
core-academic subjects, and what is meant by highly-qualified professional
development.
March 2006:
The Center on Education Policy in Washington, DC released
From the Capital to the Classroom: Year 4 of the No Child Left Behind Act
(http://web.archive.org/web/20210416123800/https://www.cep-dc.org/displayDocument.cfm?DocumentID=301).
Research for this annual report on the implementation of NCLB included a
survey of all 50 states and a national representation of 299 districts, case
studies of 38 geographically diverse districts and 42 schools, analyses of
critical issues, and three national forums. The summary of this report
reveals four broad conclusions as to what happened during 2005:
NCLB has impacted teaching and learning. There has been an effort to align curriculum and instruction with state academic standards and assessments. Schools are making better use of data to assist with planning instruction to meet individual student and group needs. However, there has been narrowing of curriculum in at least one subject area to accommodate an increase in time devoted to reading and mathematics. Case studies revealed that teaching is becoming more prescriptive. There is skepticism among the surveyed state and district officials as to whether the quality of teaching has been improved, even though teachers are meeting the highly qualified conditions mandated by NCLB.
According to state and local officials surveyed, scores have risen on state tests in a large majority of states and school districts. Factors were attributed to the adequate yearly progress requirement of NCLB, but far more attributed gains to school district policies and programs.
Although there may be different schools each year, the overall percentage and number of schools identified in need of improvement has varied little. Percentages of eligible students exercising the option of school choice (less than 2%) and participating in supplementary education services (tutoring, around 20%) remains low over the last two years.
NCLB is increasingly having the greatest effects in urban districts. A major reason is due to their diversity. The majority (54%) of Title I schools identified in need of improvement are in urban districts. Urban districts are more affected by sanctions because of their size and greater number of low-income students (poverty has been linked to achievement).
January 13, 2009:
As reported in the Chicago Sun Times by Lynn Sweet,
Arne Duncan sails through confirmation hearing for Education Secretary.
In the hearing Duncan stated, "I know that the reauthorization of No Child Left Behind will be a
priority for the 111th Congress. I have seen first-hand the impact of the
federal law on our students and schools. I have seen the law's power and its
limitations. I agree with the President-elect that we should neither bury NCLB
nor praise it without reservation. I support the core goals of high standards
for all - black and white, poor and wealthy, students with disabilities, and
those who are just learning to speak English. Like President-elect Obama, I am
committed to closing achievement gaps, raising expectations and holding everyone
accountable for results" (section: Testimony of Education Secretary-designate Arne
Duncan before the Committee on Health, Education, Labor, and Pensions, United
States Senate).
August 12, 2009:
The National Center for Analysis of Longitudinal
Data in Education Research (CALDER) and the National Center for
Performance Incentives (NCPI) hosted a research conference entitled
NCLB: Emerging Findings, the purpose of which was "to present and
debate emerging findings on the merits and the weaknesses of the No
Child Left Behind Act." See presentations at
https://my.vanderbilt.edu/performanceincentives/conferences/2009-nclb-conferene-with-calder/nclb-presentations/
February 12, 2010:
While speaking to school superintendents during the American Association
of School Administrators’ National Conference on Education, Education
Secretary Arne Duncan outlined the Obama administration's vision for
rewriting the No Child Left Behind law. He identified three
principles that will guide the administration’s approach: (1) higher
standards, (2) rewarding excellence, and (3) a “smarter, tighter federal
role” in ensuring that all students succeed. Read Dennis Pierce's
full commentary of February 14 in eSchool News:
Duncan offers ‘guiding principles’ for rewriting NCLB.
Read more about the No Child Left Behind Act:
The full text of Public Law 107-110, the No Child Left Behind Act of 2001, from the U.S. Department of Education at https://www.govinfo.gov/content/pkg/PLAW-107publ110/pdf/PLAW-107publ110.pdf
Robert Linn, Founding Co-Director of the National Center for Research on Evaluation, Standards, and Student Testing, used an example to walk the reader through the steps for determining adequate yearly progress in his Winter 2003 policy brief #6, Requirements for Measuring Adequate Yearly Progress. He discussed Fixing the NCLB accountability System in policy brief #8, Summer 2005. Also see publications at https://cresst.org/publications/
Schools that fail to meet Adequate Yearly Progress goals for a third consecutive year must offer parents of low-income (Title I) students a choice of tutoring from among a state-approved list of Supplemental Education Service (SES) providers. Get more information in Supplemental Educational Services Under NCLB: State Implementation for Students with Disabilities.
In What to Do with No Child Left Behind? Why the law will need more than a name change (October 15, 2008), Richard Kahlenberg discussed the three central flaws of No Child Left Behind legislation, which could undermine the standards-based-reform movement. His commentary also included the solutions that scholars in the field proposed to those defects: the underfunding of NCLB; the flawed implementation of its standards, testing, and accountability provisions; and the failure to provide students in low-performing schools a genuine opportunity to transfer to much better ones. Kahlenberg is the editor of Improving on No Child Left Behind: Getting Education Reform Back on Track.
 On December 10, 2015, President Barack Obama signed into law the
Every Student Succeeds Act (ESSA), thus replacing the
controversial NCLB Act. ESSA maintains the requirement
that each state implement "a set of high quality student academic assessments in
mathematics, reading or language arts, and science" (114th Congress, 2015, p. S.1177-24)
among its provisions. Further, mathematics and reading or language arts assessments will be
administered in each of grades 3 through 8, and at least once in grades
9 through 12 (p. S.1177-25). However, the provision of adequate yearly progress
mandated in NCLB is history (Walker, 2015).
On December 10, 2015, President Barack Obama signed into law the
Every Student Succeeds Act (ESSA), thus replacing the
controversial NCLB Act. ESSA maintains the requirement
that each state implement "a set of high quality student academic assessments in
mathematics, reading or language arts, and science" (114th Congress, 2015, p. S.1177-24)
among its provisions. Further, mathematics and reading or language arts assessments will be
administered in each of grades 3 through 8, and at least once in grades
9 through 12 (p. S.1177-25). However, the provision of adequate yearly progress
mandated in NCLB is history (Walker, 2015).
ESSA
at the U.S. Department of Education is highly recommended as the primary
source for news on the Every Student Succeeds Act,
which President Obama signed on December 10, 2015. This act
replaces the NCLB law of 2001. Also get the latest on effective
teaching, accountability and reports, choices for parents, and more.
Evidence for ESSA is a free website from the Center for Research and Reform in Education at Johns Hopkins University, which began in 2017. It's purpose is to provide educators with the most up-to-date and reliable information regarding K-12 programs (e.g., in math and reading) that meet the strong, moderate, and promising evidence criteria per the ESSA.
Evidence for ESSA: Standards and Procedures Version 2.0 was released in May 2023. This version was written to better help educators select effective tools and programs.
Read more about the Every Student Succeeds Act:
114th Congress of the United States. (2015). Every Student Succeeds Act. https://www.ed.gov/laws-and-policy/laws-preschool-grade-12-education/every-student-succeeds-act-essa
Transitioning to the Every Student Succeeds Act (ESSA): Frequently Asked Questions (2016, February 26) was released by the U.S. Department of Education. It contains general guidance on ESSA, and guidance on ESSA flexibility, and transition guidance regarding Title I, Title II, and Title III programs and requirements.
Alliance for Excellent Education: Everything You Need to Know about the Every Student Succeeds Act. You'll find print and video analyses of several ESSA provisions: Accountability (also including a January 2016 chart comparing accountability provisions in NCLB to ESSA), Assessments, High Schools, Teachers and School Leaders, Linked Learning, Deeper Learning, Digital Learning, and several recommendations on ESSA implementation.
The Brookings Institute on the topic K-12 education includes ESSA reports and commentary, such as Familiar fissures evident in ESSA implementation debate by Elizabeth Mann (August 3, 2016) and The future of accountability under ESSA by Diana Quintero (July 29, 2016).
For those who are curious about the difference between ESSA and NCLB, see the analysis posted at Understood
April 9, 2007:
The U.S. Department of Education released
Final Rule 34 CFR
Parts 200 and 300: Title I—Improving the Academic Achievement of the
Disadvantaged; Individuals with Disabilities Education Act (IDEA). Federal
Register, 72(67), Washington DC: Author.
The intent of this rule is to "provide States with additional flexibility
regarding State, local educational agency (LEA), and school accountability for
the achievement of a small group of students with disabilities whose progress is
such that, even after receiving appropriate instruction, including special
education and related services designed to address the students’ individual
needs, the students’ individualized education program (IEP) teams (IEP Teams)
are reasonably certain that the students will not achieve grade-level
proficiency within the year covered by the students’ IEPs" (Summary section).
These amended No Child Left Behind regulations gave states the option of
developing alternative assessments based on modified achievement standards
(AA-MAS) to be administered to such students.
December 2007:
Readers interested in how states are developing AA-MAS
as per the April, 2007, Final Rule 34 CFR Parts 200 and 300 should read:
Lazarus, S. S., Thurlow, M. L., Christensen, L. L., & Cormier, D. (2007).
States’ alternate assessments based on modified achievement standards (AA-MAS)
in 2007 (Synthesis Report 67). Minneapolis, MN: University of Minnesota,
National Center on Educational Outcomes.
https://nceo.umn.edu/docs/OnlinePubs/Synthesis67/Synthesis67.pdf.
"In July 2007 six states had an assessment either in place or in development that they considered to be an AA-MAS, but none had as of yet gone through the U.S. Department of Education’s peer review process. This study compiled and summarized information about these assessments" (p. 7), based on publicly available information at the time. State documents used in the analysis were from Kansas, Louisiana, North Carolina, North Dakota, Oklahoma, and Maryland.
December 12, 2007:
Growth models on the rise. In
Growth
'pilot' now open to all states, David Hoff (2007) reports that all states
that meet federal criteria will now be allowed to take part in the U.S.
Department of Education’s 2-year-old experiment with “growth models."
March 2009:
Charles Barone (2009) of the Education Sector reported on
Are we there yet? What policymakers can learn from Tennessee's growth model. Tennessee was one of the first seven states that former
Secretary of Education Spellings approved to use a
"growth-to-proficiency" model (p. 1). Barone reported on the
advantages and disadvantages of this model, which he hopes will "help
those involved in this process to make more thoughtful and informed
decisions by examining the approach" of Tennessee (p. 2). Note: The
Education Sector
joined the American Institutes for Research in 2013; For current
information on policies, see
https://www.air.org/our-work/education/education-policy
Effective
and accurate growth models can include a combination of state
assessments, teacher-developed assessments, portfolios, grade point
averages, and performance assessments such as essays and projects.
In A Practioner's Guide to Growth Models by Katherine Castellano and Andrew Ho (2013, February), the authors say "A growth model is a collection of definitions, calculations, or rules that summarizes student performance over two or more time points and supports interpretations about students, their classrooms, their educators, or their schools" (p. 16). However, "Growth models are quickly changing to meet the needs of local, state, and federal goals, reforms, and policies" (p. 17). In seven chapters, Castellano and Ho elaborated on seven widely used growth models of interest and labeled them by their most common names: Gain Score, Trajectory, Categorical, Residual Gain, Projection, Student Growth Percentile, and Multivariate.
June 25, 2009:
School
Accountability: A Broader, Bolder Approach, Report of the Accountability Committee of the Broader Bolder Approach to Education
Campaign is released proposing a new accountability system designed to
overcome weaknesses in No Child Left Behind. This new system would
combine both qualitative and quantitative methods. "The Broader, Bolder
Approach campaign proposes a new accountability system whose chief
elements are: 1) an expansion and coordination of federal data
collection, including expansion of the National Assessment of
Educational Progress, to provide comparative state-by-state information
on the broad range of knowledge and skills that students need for
success; and 2) federally approved and supported (but not designed)
state systems of school inspection that ensure that schools are
generating adequate outcomes on this range of knowledge and skills, and
are following practices likely to generate these outcomes" (p. 6).
HOT: October 24, 2015:
The growing concern about student testing led the U.S. Department of Education
to issue its press release:
Fact Sheet: Testing Action Plan. The concern: "In too many
schools, there is unnecessary testing and not enough clarity of purpose
applied to the task of assessing students, consuming too much
instructional time and creating undue stress for educators and students.
The Administration bears some of the responsibility for this, and we are
committed to being part of the solution" (para. 2).
The press release elaborated on seven principles for fewer and smarter assessments. Assessments must be worth taking, of high quality, time limited (i.e., "states [should] place a cap on the percentage of instructional time students spend taking required statewide standardized assessments to ensure that no child spends more than 2 percent of her classroom time taking these tests"), fair "including providing fair measures of student learning for students with disabilities and English learners," transparent to students and parents, just one of multiple measures, and tied to improved learning. The press release also included administrative actions it is undertaking to reduce over-testing.
HOT: August 11, 2016:
The Brookings Institute released its Evidence Speaks Report (Vol. 1, #25),
Student test scores: How the sausage is made and why you should care,
authored by Brian Jacob. The K-12 report cautions educators and
policymakers about the use of standardized test scores to make
high-stakes decisions regarding teachers, students, and schools. Per the Executive Summary:
Contrary to popular belief, modern cognitive assessments—including the new Common Core tests—produce test scores based on sophisticated statistical models rather than the simple percent of items a student answers correctly. While there are good reasons for this, it means that reported test scores depend on many decisions made by test designers, some of which have important implications for education policy. For example, all else equal, the shorter the length of the test, the greater the fraction of students placed in the top and bottom proficiency categories—an important metric for state accountability. On the other hand, some tests report “shrunken” measures of student ability, which pull particularly high- and low-scoring students closer to the average, leading one to understate the proportion of students in top and bottom proficiency categories. Shrunken test scores will also understate important policy metrics such as the black-white achievement gap—if black children score lower on average than white children, then scores of black students will be adjusted up while the opposite is true for white students.
The scaling of test scores is equally important. Despite common perceptions, a 5-point gain at the bottom of the test score distribution may not mean the same thing in terms of additional knowledge as a 5-point gain at the top of the distribution. This fact has important implications for the value-added based comparisons of teacher effectiveness as well as accountability rankings of schools. ... (p. 1)
HOT: March 14, 2018:
Education First released results from its research on "What
Happened to State Tests?" The analysis delved into all 50 states, noting
that there has been a significant decrease in membership in the two
consortia, PARCC or Smarter Balanced. The consortia's goal was to
develop high quality state summative assessments to be used by the
membership states of each. In 2010, 46 states were members in either
of those consortia. By 2017 consortia membership decreased to 20
states in which "16 of these states fully participate[d] in PARCC or Smarter
Balanced, while an additional four states populate[d] their assessments with
consortia items" (p. 3). Other key findings:
ASCD News and Media
includes ASCD responses to a variety of issues affecting education. Subscribe to
newsletters from
SmartBrief, such as ASCD SmartBrief
and the Math Education Smartbrief. It's free.
Council for Exceptional Children: Policy & Advocacy examines policy issues and provides information on special education trends and other developments affecting the education of children with exceptionalities and the professionals who work with them.
EdSurge.com produces a free weekly newsletter on edtech products, companies, and events. You'll also find a "community driven" database of edtech products, including those related to curriculum, classroom teaching needs (e.g., assessment, classroom management, collaboration, etc.), school operations, and more.
Education Commission of the States features news on education policy issues ranging from early learning through post secondary. You can also learn about state legislation.
Education Week provides news, special reports (including coverage of the the latest findings and trends in education research and the impact of technology on education), state information (key players, key statistics, legislative updates, and past stories), and access to Teacher Magazine. You can sign up for a number of weekly or monthly newsletters. Education Week also offers free webinars on current topics of interest, which are archived for six months after their presentation.
Education World's free weekly newsletter sent to your email address will keep you up-to-date with the latest education news, lesson ideas, teaching tips, and more.
eSchool News developed for K-12 decision-makers, covers all aspects of school technology news, events, issues, key players, products, services, and strategies. Also learn about the business and political issues impacting school technology.
Learning First Alliance reports on what's working in public schools in its Public School Insights.
Network for Public Education (NPE) was founded in 2013 by Diane Ravitch and Anthony Cody. NPE is "an advocacy group whose mission is to preserve, promote, improve and strengthen public schools."
TechLearning News is brought to you by TechLearning.com. Technology & Learning magazine and Intel Corporation also sponsor K-12 Computing Blueprint, which focuses on planning and implementing technology initiatives, such as one-to-one or bring-your-own computing. You can subscribe to the weekly newsletters. Research results, funding, leadership, infrastructure, professional development, and curriculum information using mobile devices are provided.
U.S. Department of Education has multiple categories for information.
114th Congress of the United States. (2015). Every Student Succeeds Act. https://www.ed.gov/laws-and-policy/laws-preschool-grade-12-education/every-student-succeeds-act-essa
107th Congress of the United States. (2002). Public Law 107-110: No Child Left Behind Act of 2001. https://www.govinfo.gov/content/pkg/PLAW-107publ110/pdf/PLAW-107publ110.pdf [Note: The pdf document has 670 pages with the first numbered as 115 STAT. 1425.]
Barone, C. (2009, March). Are we there yet? What policymakers can learn from Tennessee's growth model. Education Sector Technical Reports. Washington, DC: Education Sector. https://web.archive.org/web/20110816014900/http://www.educationsector.org/usr_doc/Are_We_There_Yet.pdf
Barshay, J. (2018, April 10). National test scores reveal a decade of educational stagnation. The Hechinger Report. https://hechingerreport.org/national-test-scores-reveal-a-decade-of-educational-stagnation/
Brookhart, S. (2009, November). The many meanings of "multiple measures." Educational Leadership, 67(3), 6-12. http://web.archive.org/web/20210428190753/http://www.ascd.org/publications/educational-leadership/nov09/vol67/num03/The-Many-Meanings-of-£Multiple-Measures£.aspx
Charischak, I. (2009, June 3). What's missing from this picture? CLIME Connections. http://www.clime.org/2009/06/whats-missing-from-this-picture.html
Federal Communications Commission. (2010, March 17). Connecting America: The National broadband plan. https://transition.fcc.gov/national-broadband-plan/national-broadband-plan.pdf
Hoff, D. (2007, December 12). Growth 'pilot' now open to all states. Education Week, 27(15), 1, 20. https://www.edweek.org/ew/articles/2007/12/12/15growth.h27.html
Nagel, D. (2010, November 9). National ed tech plan puts technology at the heart of education reform. THE Journal. https://thejournal.com/articles/2010/11/09/national-ed-tech-plan-puts-technology-at-the-heart-of-education-reform.aspx
National Council of Teachers of Mathematics. (2006a). Curriculum focal points for prekindergarten through grade 8 mathematics: A quest for coherence. Reston, VA: Author. https://www.nctm.org/store/Products/Curriculum-Focal-Points-for-Prekindergarten-through-Grade-8-Mathematics-A-Quest-for-Coherence/
National Council of Teachers of Mathematics. (2006b, September 12). NCTM Releases Curriculum Focal Points to Focus Math Curricula. Reston, VA: NCTM News Release. https://web.archive.org/web/20170224130843/https://www.nctm.org/News-and-Calendar/News/NCTM-News-Releases/NCTM-Releases-Curriculum-Focal-Points-to-Focus-Math-Curricula/
National Council of Teachers of Mathematics. (2009a, June). Guiding principles for mathematics curriculum and assessment. Reston, VA: Author. https://web.archive.org/web/20151024005936/http://scimath.unl.edu/MIM/coursematerials/files/TEAC%20801/2.%20Handouts/01.%20NCTM%20Guiding%20Principles%20for%20Math%20Curriculum%20and%20Assesment.pdf
National Council of Teachers of Mathematics. (2009b). Focus in High School Mathematics: Reasoning and Sense Making. Reston, VA: Author. https://www.nctm.org/store/Products/Focus-in-High-School-Mathematics--Reasoning-and-Sense-Making/
National Council of Teachers of Mathematics. (2009c, October 6). NCTM Releases new landmark publication: Focus in High School Mathematics: Reasoning and Sense Making. Reston, VA: NCTM News Release. https://web.archive.org/web/20161102230615/https://www.nctm.org/News-and-Calendar/News/NCTM-News-Releases/NCTM-Releases-New-Landmark-Publication_-Focus-in-High-School-Mathematics/
National Governors Association and Council of Chief State School Officers. (2009, June 1). Forty-nine states and territories join common core state standards initiative. Washington, DC: NGA Press Release. http://texasedequity.blogspot.com/2009/06/forty-nine-states-and-territories-join.html
National Mathematics Advisory Panel. (2008). Foundations for success: The final report of the National Mathematics Advisory Panel. Washington, DC: U.S. Department of Education. https://files.eric.ed.gov/fulltext/ED500486.pdf
Partnership for Assessment of Readiness for College and Careers. (2011, October). Model Content Frameworks for Mathematics, Grades 3-11. https://files.eric.ed.gov/fulltext/ED526348.pdf Note: see the updated version 5.0 of November 2017 at https://files.eric.ed.gov/fulltext/ED582070.pdf
Rudalevige, A. (2003, Fall). The politics of No Child Left Behind. Education Next, 3(4), 62-69. https://www.educationnext.org/the-politics-of-no-child-left-behind/
U.S. Department of Education Office of Educational Technology. (2022, September). Advancing digital equity for all. https://files.eric.ed.gov/fulltext/ED624655.pdf
Walker, T. (2015, December 9). With passage of Every Student Succeeds Act, life after NCLB begins. https://www.nea.org/nea-today/all-news-articles/passage-every-student-succeeds-act-life-after-nclb-begins
![]()
![]()
 Comments?
Are you finding resources at CT4ME of value?
Comments?
Are you finding resources at CT4ME of value?
How are you helping students to gain media literacy? What are your favorite news sources?
Contact Dr. Patricia Deubel: pdeubel@ct4me.net
To cite this page, use the following format:
Deubel, P. (year from last revised). K-12 math education and technology in the news. Computing Technology for Math Excellence. Retrieved Month, Day, Year, from https://www.ct4me.net/news.htm
CT4ME Author: Dr. Patricia Deubel
Copyright © 2001-2025 [CT4ME.net]. All rights reserved.